The old stats have done their dash, today it is with much excitement we present the shiny new, highly anticipated dashboard stats!
The new dashboard stats present your sales activity in an easy to digest and delightful way. While simple in appearance, you can dig deep to gain meaningful insights into how sales are performing.
Highlights of the new dashboard stats:
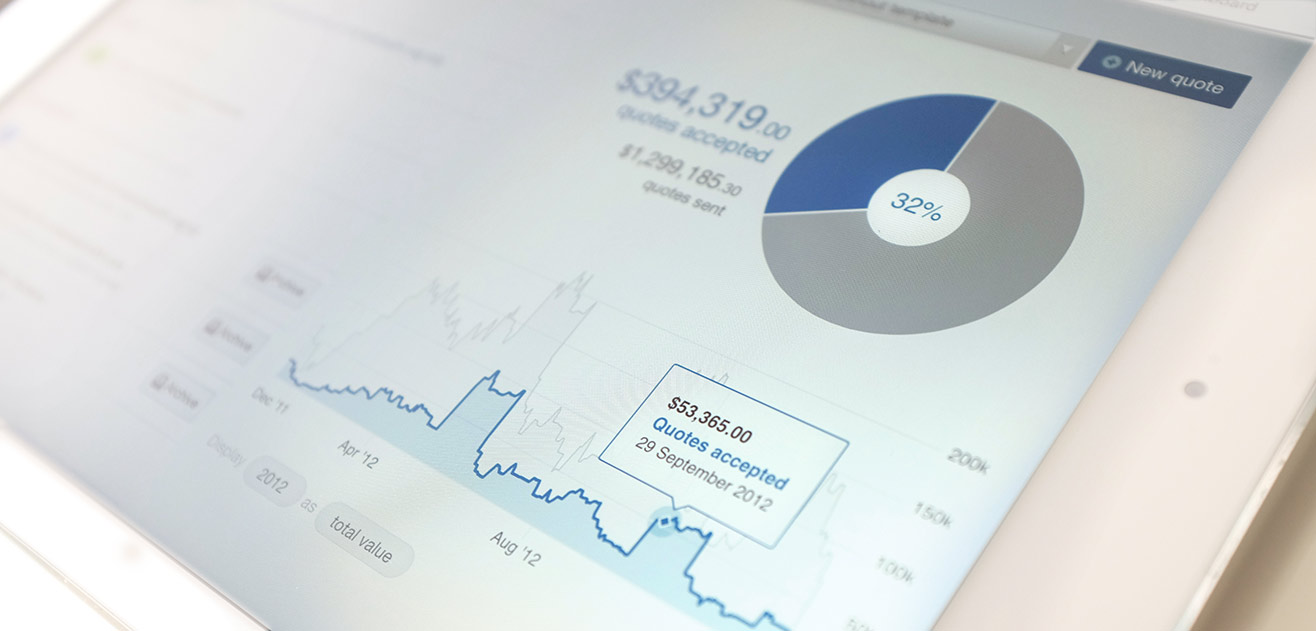
- See ‘quotes accepted’ together with (the new) ‘quotes sent’ – a great benchmark.
- Choose to view by: total value, average value or the number of quotes (count).
- Select a specific time period to display, including by year or month.
- Tool tips! – hover a specific point in time to see more detail.
- A pie chart of all quotes for the selected time period, divided into ‘accepted’, ‘awaiting acceptance’ and ‘not accepted’.
Spot trends with a rolling total
The rolling total simply smooths your data, helping you to interpret your accumulated performance at any point in time.
For example, if you invoice monthly, viewing the 30 day rolling total is like glimpsing into what your bank balance might be next month. The 7 day total can help by comparing sales performance on a weekly basis. The 1 day total is a way of seeing what happened exactly on any given day.
We invite you to have a play and trust you’ll gain a new level of understanding about your business. Tell us what you think, we love feedback!