Dashboard Stats
The Dashboard Stats give you an at-a-glance overview of your sales activity, and a quick read on how your sales, and potential sales, are tracking over time.
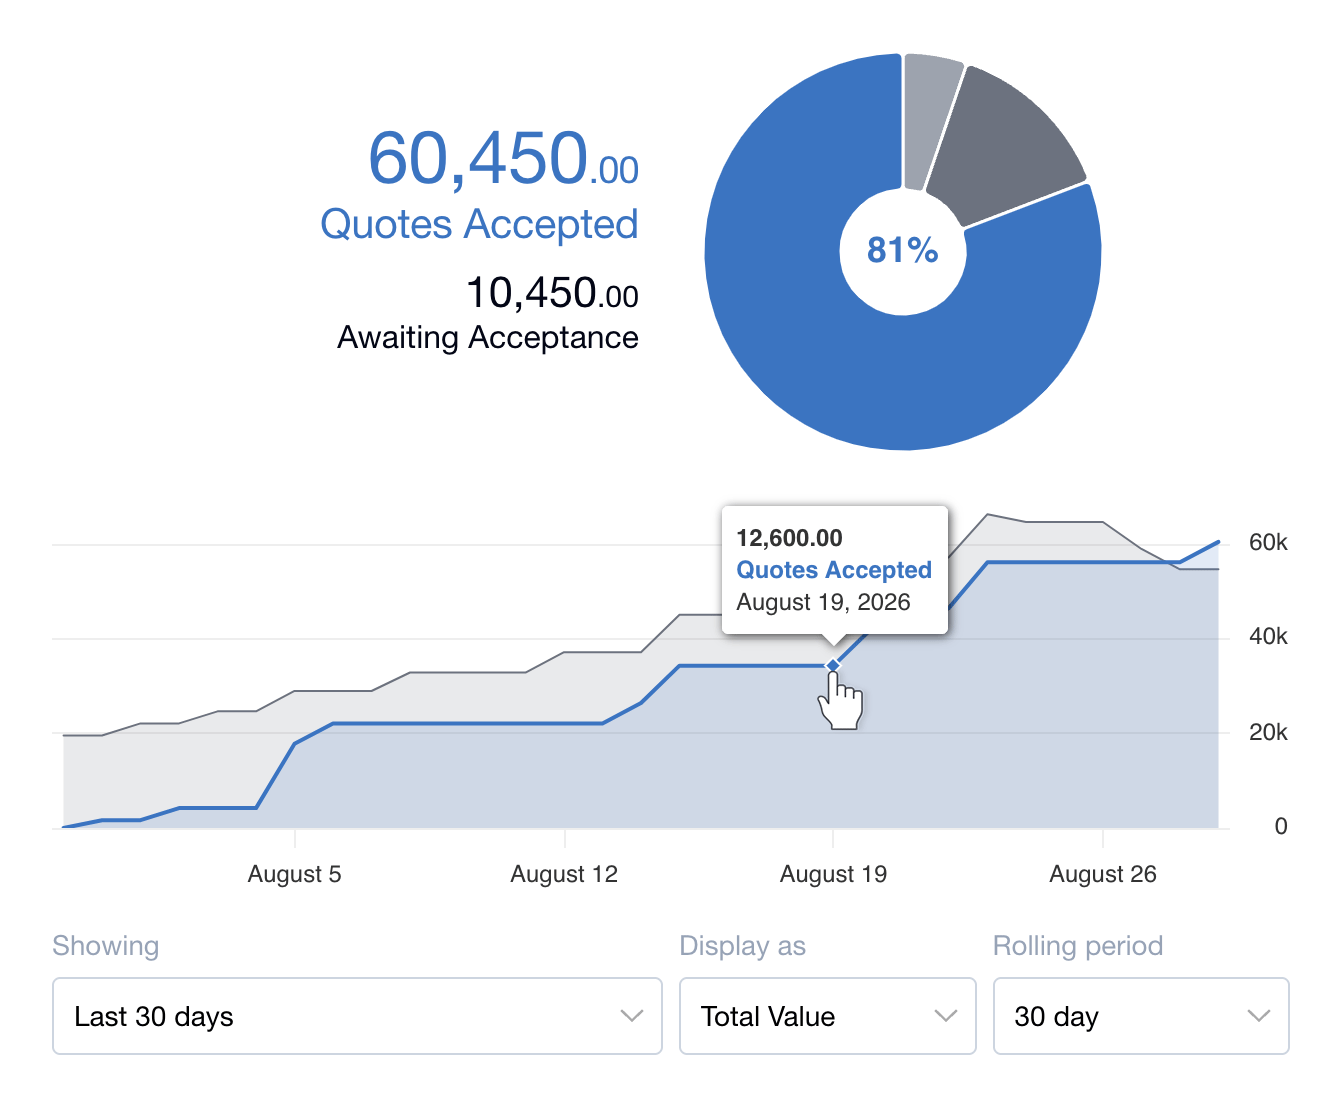
Data is pulled from your Quotes and shown two ways: Acceptance Rate and Quote Trend. Both reflect the timeframe and options set by your filters.
Acceptance Rate
Shows the proportion of Quotes that have been accepted and those still awaiting acceptance. Quotes that have expired or been declined are grouped together as Not Accepted. The percentage in the centre is your acceptance rate for the selected period.
The Display as filter changes what this percentage measures, so expect it to move when you switch between options:
- Count: the proportion of Quotes accepted.
- Total Value: the proportion of quoted value accepted.
- Average Value: the average accepted Quote compared to the average Quote awaiting acceptance.
These can be very different. If you accept most of your smaller Quotes but a few large ones are still open, your rate by Count will be high while your rate by Total Value stays low.
Quote Trend
Plots Quotes Sent against Quotes Accepted across the selected period, so you can see the gap between the two. Values are plotted daily, or smoothed into 7 or 30 day rolling totals, depending on the rolling period you choose.
Filters
The filters below the charts control what both charts show:
- Showing: the period to cover, from the last 30, 90, 180 or 365 days. You can also choose a specific month or year.
- Display as: total value of Quotes, average value per Quote, or count, which is the number of Quotes rather than their value.
- Rolling period: 1, 7 or 30 day rolling totals. This affects the Quote Trend chart only.
Quotes excluded from the Dashboard Stats
Draft and Withdrawn Quotes are not counted in the Dashboard Stats. If you withdraw an old Quote, the Dashboard Stats are updated retrospectively.
We / Me
The We / Me control on the Dashboard also applies to the Dashboard Stats.
- We: shows stats for everyone’s Quotes.
- Me: shows stats for only your Quotes.
Your selection is remembered, and also controls Open Leads and Quotes to follow up.
FAQ
Why does my acceptance rate change when I switch Display as?
Because it’s measuring a different thing each time. Count gives you the proportion of Quotes accepted, and Total Value gives you the proportion of quoted value accepted. A single large Quote sitting unaccepted can pull your rate by Total Value down sharply while barely affecting your rate by Count.
Average Value works differently again: it compares the average accepted Quote to the average Quote awaiting acceptance. A low number here doesn’t mean you’re losing work, it means the Quotes still open are larger on average than the ones you’ve won.
All three are correct. Count tells you how often you win work, and Total Value tells you how much of the money on the table you’ve converted.
What if a Quote was sent in a different month or year to when it was accepted?
Quotes are counted against the date each event happened. If a Quote was sent in January but not accepted until March, it counts towards Quotes Sent for January and Quotes Accepted for March. The same applies across calendar years.
This is worth keeping in mind when comparing your Dashboard Stats to data exported via the Import/Export tool, as exports are based on the Quote Sent date.
What if a Quote was originally sent in one month and re-sent in another?
It stays with the original month. A Quote sent in January and re-sent in March still counts towards Quotes Sent for January. The exception is if you changed the Quote Date when editing it: the Quote is then counted against the new date, so a Quote Date changed to March would move to March.
How do the rolling totals work?
Rolling totals affect the Quote Trend chart only. Set to 30 days, the chart shows a running total of the previous 30 days worth of values at each point. Set to 1 day, it shows the total for each individual day.
Are declined or expired Quotes still counted?
Yes. Quotes Sent includes every Quote you sent in the period, regardless of what happened to it afterwards, so declined and expired Quotes stay in the total. They just never appear in Quotes Accepted, which is what creates the gap between the two lines in the Quote Trend chart.
In the Acceptance Rate chart, declined and expired Quotes are grouped together as Not Accepted.
How can I get more advanced analytics and reporting?
If you need to dig deeper, you can export your raw Quote data as a CSV file. You can then compile your own custom statistics in a spreadsheet, like Google Sheets or Microsoft Excel.